Identify performance issues with queue processor and job scheduler activities in Pega
We often see Queue processor activity or a Job scheduler activity runs longer than the threshold values which is directly impacting the performance of our applications, sometimes we don't know how to investigate those performance-related things.
Pega has come up with new alerts for Long-running queue processor and Job scheduler activities from Pega 8.5.
- PEGA0117 alert: Long-running queue processor activity.
- PEGA0118 alert: Long-running job scheduler activity.
Pega now saves these alerts in the performance alert log. We can easily analyze these alerts directly in the log and address potential performance issues with long-running processes.
PEGA0117 Alert configuration for Queue processor
Queue processor rules replace standard agents in Pega and a queue processor uses an activity rule to process an item. An activity can perform various operations, often accessing a database or external services. Pega generates the PEGA0117 alert when such an activity runs longer than a configured threshold value.
The PEGA0117 alert is enabled by default and we can manage this in DSS settings. To disable this alert setting make this value "false".
We have two types of Queue processors in pega 1. Standard queue and 2. Dedicated queue and threshold value configuration is different for each type.
Standard queue processor: the threshold is configured in the Queue-For-Processing command’s parameters in an activity that queues items.
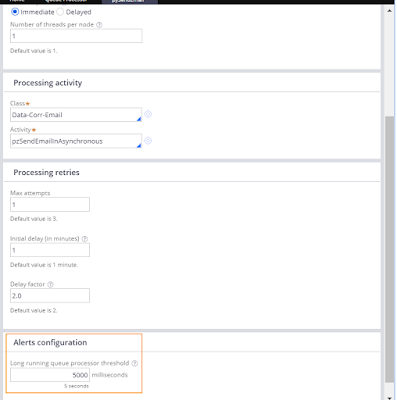
Dedicated queue processor: the threshold is configured in the queue processor’s Definition form.
For example, Below Queue Processor rule for sending emails to users, activity is the one which is sending emails to users, and the threshold value for this activity is 5000 milliseconds or 5 seconds.When the rule runs as scheduled, email processing takes more than 5 seconds, which exceeds the threshold. Pega Platform saves the PEGA0117 alert: Long-running queue processor activity to the log file as below.
2020-11-26 18:31:16,304 GMT*8*PEGA0117*35*1*a09ce1fdf185544686254f6f1655bc49*NA*NA*BKPB05APU0UBMOI5ZG4BFOPL8G1WFCRGQA*System*TP-Training-Work*MyTown311:01.01.01*9f013ffd8e4b3b32cf50f56d90952737*N*4*69A351AA8BB144684E8DEE5C94A50ED5*202*DataFlow-Service-PickingupRun-pzStandardProcessor:64, Access group: [PRPC:AsyncProcessor], PartitionsEQUALS[0,10,11,12,17,18,4,5,6,7]*STANDARD*QueueProcessorExecutor*NA*NA*Rule-Obj-Activity:pzStandardBackgroundProcessing*WORK- PZSENDEMAIL #20190606T095250.087 GMT Step: 16 Circum: 0*NA*****pxCommitRowCount=7;pxRDBIOElapsed=0.09;pxListWithUnfilteredStreamCount=2;pxRDBIOCount=44;pxJavaAssembleCount=2;pxTotalReqCPU=0.36;pxRunModelCount=4;pxRunWhenCount=47;pxDeclarativePageLoadElapsed=0.05;pxRulesExecuted=150;pxJavaGenerateCount=2;pxListRowWithUnfilteredStreamCount=3;pxOtherCount=101;pxJavaGenerateElapsed=0.05;pxDBInputBytes=298,102;pxTotalReqTime=0.54;pxActivityCount=72;pxOtherFromCacheCount=106;pxRDBWithoutStreamCount=16;pxJavaAssembleElapsed=0.00;pxCommitCount=7;pxOtherBrowseElapsed=0.00;pxDeclarativeRulesInvokedCount=6;pxInteractions=4;pxRuleCount=39;pxDeclarativeRulesLookupCount=99;pxJavaCompileElapsed=0.15;pxDeclarativeRulesInvokedElapsed=0.00;pxRuleIOElapsed=0.00;pxRulesUsed=272;pxDeclarativePageLoadCount=6;pxJavaAssembleHLElapsed=0.21;pxDeclarativeRulesLookupElapsed=0.01;pxProceduralRuleReadCount=1;pxRuleFromCacheCount=83;pxOtherIOElapsed=0.05;pxRuleBrowseElapsed=0.01;pxCommitElapsed=0.04;pxTrackedPropertyChangesCount=17;pxDBOutputBytes=37,053;pxRDBRowWithoutStreamCount=78;pxDeclarativeNtwksBuildHLElapsed=0.01;pxOtherIOCount=53;pxJavaCompileCount=2;pxDeclarativeNtwksBuildConstElapsed=0.00;*NA*NA*NA*NA*;initial Executable;0 additional frames in stack;*BatchSize=[removed];UID=[removed];pyEventStrategyStorePartitionCount=[removed];pyEventStrategyForceExpire=[removed];pyEventStrategyStorePartitionScheme=[removed];KeyValueStoreFactory=[removed];pyEventStrategyStorageSchemeKey=[removed];PartitioningFeature=[removed];pyReportPageName=[removed];RunId=[removed];pyCacheSize=[removed];*Long running queue processor activity{queue processor=pzStandardProcessor, ruleset=Pega-RulesEngine, ruleset version=08-05-01, execution time (ms)=35, exceeded threshold value (ms)=1} Producer operator{id=pegahelp, name=PegaHelp} Producer activity{class name=TP-Training-Work-ServiceRequest, activity name=SendEmailNotifications, activity step=1, ruleset=MyTown311, ruleset version=01-01-03, circumstance=0} Consumer activity{class name=TP-Training-Work-ServiceRequest, activity name=pzSendEmail, ruleset=Pega-ProcessArchitect, ruleset version=08-04-01, circumstance=}*
Reasons for the alert
Queue processor activity execution depends on what is the activity is using, below could be some of the possible reasons for the delay:
- Report rules might be slow for many reasons, for example, too much data extracted from storage, unoptimized data access, or a complex report that uses many different classes. Similar issues might be experienced when using the Obj-Browse method to extract data from external storage. For more information about alerts that are related to slow database access.
- Accessing REST or SOAP web services might extend the time during which the activity is run.
- Integrating with external services, such as JMS, FTP server, or email server, can also result in a longer execution time of an activity
We can resolve some of the issues by Optimizing activities and adjusting threshold values.
PEGA0118 alert Long-running job scheduler activity
Job schedulers run in the background and execute a configured activity. Such processing is very specific to the business domain of a Pega Platform application. An activity can perform various operations, often accessing external data sources or services inefficiently.
Pega generates the PEGA0118 alert when activity in a job scheduler runs for a longer time than the configured threshold value.
The threshold value is configured in Job Scheduler's rule definition tab.
The PEGA0118 alert is enabled by default and we can manage this in DSS settings. To disable this alert setting make this value "false".
Alert message:
Long running job scheduler activity{job scheduler=Pega0118AlwaysAlerting, ruleset=AsyncPro, ruleset version=01-01-01, execution context=System-Runtime-Context, execution time (ms)=1524, threshold value (ms)=500} Activity{class name=@baseclass, activity name=SimpleLog, ruleset=AsyncPro, ruleset version=01-01-01, circumstance=}
Reasons for the alert
Queue processor activity execution depends on what is the activity is using, below could be some of the possible reasons for the delay:
- Report rules might be slow for many reasons, for example, too much data extracted from storage, unoptimized data access, or a complex report that uses many different classes. Similar issues might be experienced when using the Obj-Browse method to extract data from external storage. For more information about alerts that are related to slow database access.
- Accessing REST or SOAP web services might extend the time during which the activity is run.
- Integrating with external services, such as JMS, FTP server, or email server, can also result in a longer execution time of an activity
We can resolve some of the issues by Optimizing activities and adjusting threshold values.
See more on Job Scheduler and Queue Processor rule.


No comments:
Post a Comment